
Certificate of Analysis (CoA): How to Read HPLC Purity Reports
4th Sep 2026
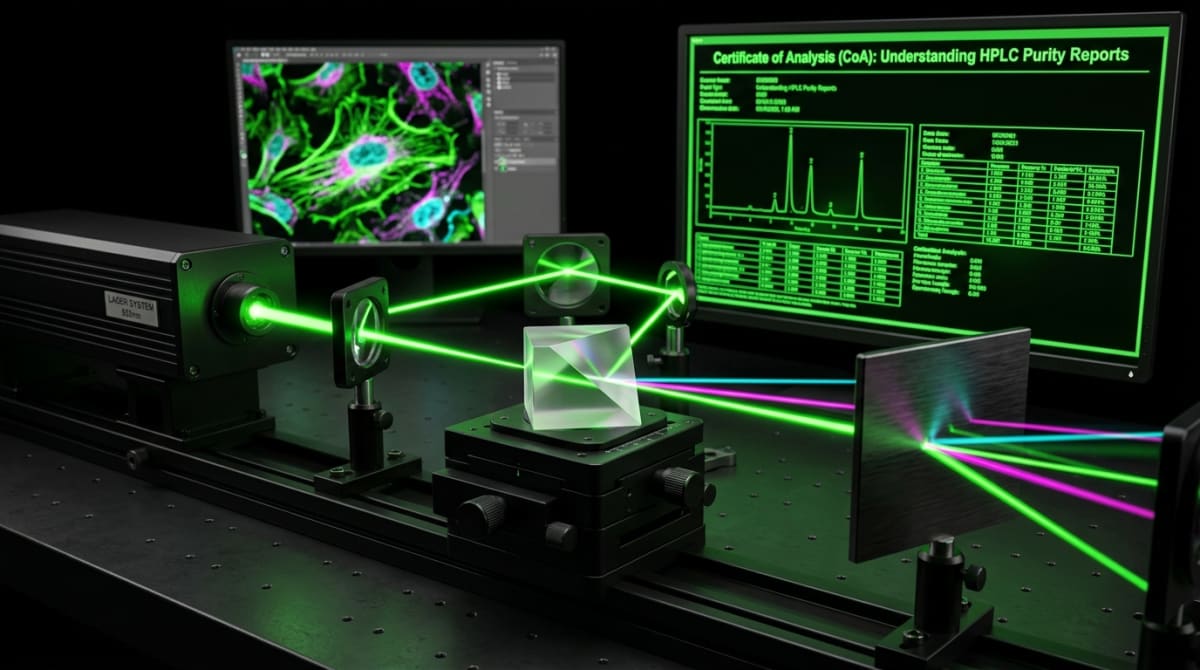
A laboratory cannot assume a chemical is pure simply because a supplier claims it is. When researchers order synthetic compounds for in-vitro testing, they require hard chemical data to verify exactly what is inside the vial. A Certificate of Analysis (CoA) serves as this proof. It is a strict chemical audit that details the exact purity and identity of a compound. Without a valid CoA, any data generated during an experiment is fundamentally compromised by unknown variables.
Scientific Abstract: The Certificate of Analysis (CoA) functions as the primary quality control document for synthetic laboratory compounds. It relies heavily on two analytical techniques: High-Performance Liquid Chromatography (HPLC) to determine compound purity, and Mass Spectrometry (MS) to verify molecular mass. Together, these methods confirm that a synthesised sequence matches its intended chemical structure and remains free from significant synthesis by-products or heavy metal contamination.
A complete CoA must always include two distinct visual graphs. The HPLC graph shows purity as a percentage based on light absorbance, while the MS graph confirms the molecular weight of the compound. If a report only shows a typed percentage without the accompanying raw graphs, the data cannot be independently verified by the researcher.
High-Performance Liquid Chromatography sounds like complex laboratory jargon, but it is essentially a highly accurate sorting machine. To test a sample, a technician dissolves a small amount of the compound into a liquid solvent. This liquid is called the mobile phase. The machine then pumps this liquid at high pressure through a tightly packed metal tube, known as the column or the stationary phase. Different molecules travel through this packed column at different speeds. Smaller or more soluble molecules slip through quickly, while larger or stickier molecules take longer to emerge from the other side.
As the liquid exits the column, it passes under an ultraviolet (UV) light detector. Every time a cluster of molecules passes the light, the detector records a drop in light transmission and draws a peak on a graph. This graph is called a chromatogram. The horizontal axis shows time, and the vertical axis shows the intensity of the UV absorbance. In a highly pure sample, almost all the molecules are identical, meaning they all exit the column at exactly the same time.
A sharp, narrow peak indicates a highly pure sample.
If the sample contains synthesis errors, broken amino acid chains, or leftover chemical reagents, these impurities will exit the column at different times. They will appear on the graph as smaller secondary peaks or as a bumpy, uneven baseline. The HPLC software calculates purity by measuring the total area under the main peak and comparing it to the total area of all the smaller peaks combined. If the main peak accounts for 99% of the total area, the sample has a 99% HPLC purity rating.
However, HPLC alone is not enough. HPLC only measures how pure a substance is; it does not tell the researcher what the substance actually is. A vial of pure table salt would show a beautiful, single peak on an HPLC graph, but it would be useless for peptide research. To confirm the identity of the compound, laboratories must use Mass Spectrometry (MS).
Mass Spectrometry weighs the molecules in the sample. The machine blasts the compound with electrons, turning the molecules into charged ions. It then passes these ions through a magnetic field to measure their mass-to-charge ratio. Every synthetic sequence has a precise, theoretical molecular weight based on its atomic structure. If the mass measured by the MS machine matches the theoretical mass of the intended compound, the laboratory can confirm the identity of the chemical.
When reviewing a CoA, researchers must look for common red flags. The baseline of the HPLC graph should be flat and straight. If it looks like a jagged mountain range, the sample is full of trace impurities. Furthermore, the axes of the graphs must be clearly labelled. Some low-quality reports zoom in so closely on the main peak that the smaller impurity peaks are cut out of the frame. Researchers must also verify the testing date and ensure the report comes from an independent, third-party analytical laboratory rather than an in-house quality check.
When sourcing research peptide compounds, laboratories must demand these raw data graphs before proceeding with any cellular assays. A typed number on a piece of paper is not evidence. Researchers can often cross-reference batch numbers against a verified CoA directory to ensure the document has not been altered or forged. If the batch number on the vial does not match the batch number on the HPLC report, the data is irrelevant to that specific sample.
Frequently Asked Questions
Why do laboratory compounds require both HPLC and MS testing?
HPLC only separates molecules and measures their relative abundance, providing a purity percentage. It cannot identify the chemical structure. Mass Spectrometry (MS) is required to measure the exact molecular weight of the compound, confirming that the synthesised sequence matches the intended target. Both are required for a complete chemical profile.
What does a purity score of 99% actually mean in vitro?
A 99% purity score means that 99% of the UV-absorbing material detected during the HPLC run belongs to the primary target compound. The remaining 1% consists of synthesis by-products, truncated sequences, or residual solvents. In sensitive cellular assays, even a 1% impurity can introduce unwanted variables, which is why researchers seek the highest possible purity.
Can a bacteriostatic reconstitution solution affect the HPLC readout?
Yes. A bacteriostatic reconstitution solution contains preservatives, typically benzyl alcohol, to prevent bacterial growth in the vial. If a researcher runs a reconstituted sample through an HPLC machine, the benzyl alcohol will separate and appear as its own distinct, large peak on the chromatogram, skewing the purity calculation. This is why official CoA testing is always performed on the dry, lyophilised powder before any reconstitution solvent is introduced.
Scientific Bibliography
- D'Hondt, M., et al. (2014). Related impurities in peptide medicines. Journal of Chromatography A, 1363, 43-51. View published research
- Katta, V., et al. (1991). High-performance liquid chromatography and mass spectrometry of peptides. Analytical Chemistry, 63(17), 1748-1752. View published research
- Chen, Y., et al. (2019). Quality control of synthetic peptides by LC-MS. Methods in Molecular Biology, 2001, 145-154. View published research
- Fekete, S., et al. (2014). Liquid chromatography of recombinant proteins and protein drugs. Journal of Pharmaceutical and Biomedical Analysis, 69, 9-27. View published research
- Ewles, M., & Goodwin, L. (2011). Bioanalytical approaches to analysing peptides and proteins by LC-MS/MS. Bioanalysis, 3(12), 1379-1397. View published research
- Holcapek, M., et al. (2012). Basic rules for the interpretation of atmospheric pressure ionization mass spectra of small molecules. Journal of Chromatography A, 1259, 3-15. View published research
- Stoll, D. R., et al. (2007). Comprehensive two-dimensional liquid chromatography. Journal of Chromatography A, 1168(1-2), 3-43. View published research
⚠️ Research Use Only Disclaimer: All peptides and compounds are sold strictly for in-vitro laboratory research purposes only. Not intended for human or veterinary use, not a dietary supplement, and not approved to diagnose, treat, cure, or prevent any disease or condition. For use by qualified researchers in suitably equipped laboratory environments only. Amino Peptides Ltd operates in full compliance with UK MHRA regulations and applicable EU research chemical guidelines.