
Evaluating Spectral Physics in Laboratory Environments
19th Jul 2026
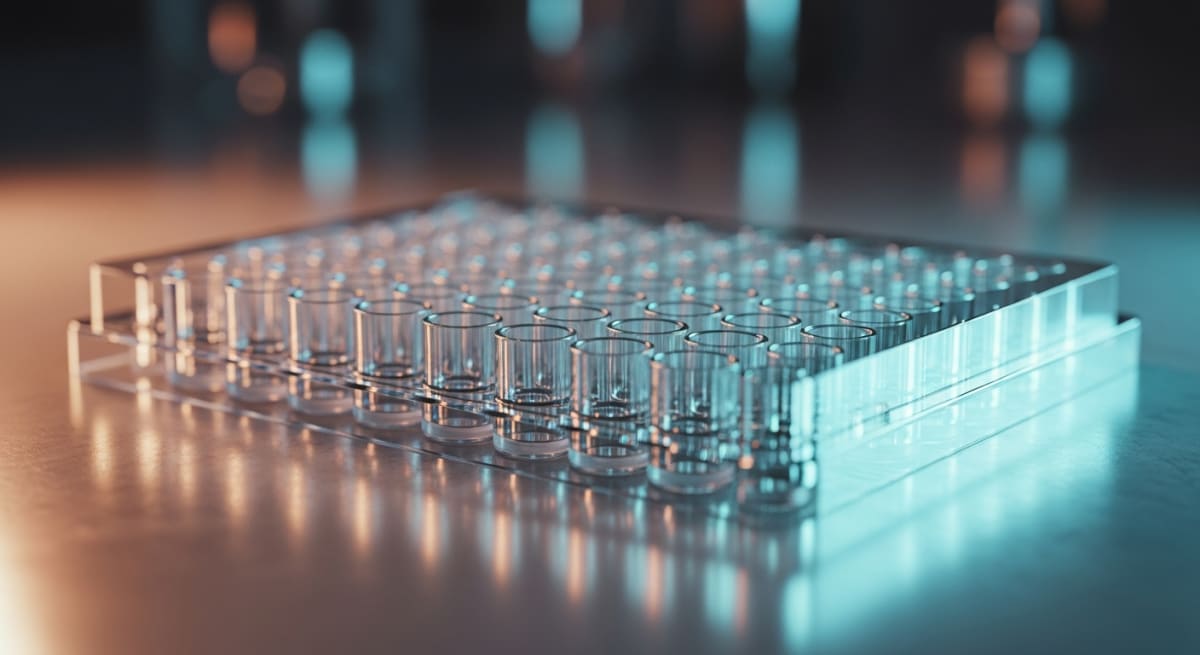
What You Need to Know About Evaluating Spectral Physics in Laboratory Environments
- Researchers search for this topic to verify the purity, folding patterns, and structural stability of synthetic peptides in controlled laboratory models.
- The core mechanism relies on shining specific wavelengths of light through a sample to measure how chemical bonds absorb, scatter, or rotate photons.
- Published studies observe that distinct amino acid sequences produce unique spectral fingerprints that confirm whether a sample is intact or degraded.
- Standardising optical path lengths and buffer backgrounds allows scientists to compare measured levels of protein aggregation across different laboratory environments.
How Light Waves Reveal Cellular Energy and Recovery Signals
Evaluating spectral physics in laboratory environments lets researchers watch how molecules absorb, bend, and emit light to track cellular energy and tissue recovery in real time. By measuring these exact wavelengths, scientists can see whether a peptide is folded properly and actively signalling inside a dish without destroying the sample.
At the basic level, every amino acid chain interacts with light in a predictable way. When a beam of ultraviolet or visible light passes through a liquid sample, specific chemical bonds soak up distinct bands of energy. Aromatic rings in amino acids like tryptophan and tyrosine absorb ultraviolet light around two hundred and eighty nanometres. Meanwhile, the flat peptide bonds holding the chain together absorb deeper ultraviolet rays closer to two hundred and ten nanometres. By reading the exact shadow left behind on a detector, investigators can confirm the measured level of a compound in seconds.
Beyond simple counting, light waves show how a molecule twists and folds. A technique called circular dichroism shines left-handed and right-handed polarised light through a quartz cuvette. If the peptide coils into a spring-like alpha helix or flattens into a beta sheet during a tissue remodelling assay, it bends the two light beams differently. This tells the lab team whether the sequence holds the right three-dimensional shape to lock onto cellular receptors linked to skin elasticity or mitochondrial energy production.
Fluorescence spectroscopy takes this a step further by tracking light emission. When certain molecules absorb a high-energy photon, they pause for a few nanoseconds and release a lower-energy photon of a different colour. In preclinical models looking at cellular energy, natural coenzymes like NADH glow under specific excitation wavelengths. Watching this glow brighten or dim shows researchers how quickly mitochondria are turning nutrients into adenosine triphosphate (ATP). Because evaluating spectral physics in laboratory environments does not tear the sample apart, the exact same dish of cells can be checked repeatedly as recovery pathways switch on.
This page is not tied to one stocked vial. Start with the bundles hub, BPC-157, or GHK-Cu — each is in stock for next-day UK dispatch.
Browse Full UK Peptide Catalogue →Tracking Optical Shifts From First Flash to Structural Change
When evaluating spectral physics in laboratory environments, observed outcomes split clearly into fast optical flashes and slower structural rearrangements. Light-based instruments capture events across wildly different clocks, ranging from fractions of a second to several weeks of culture observation.
In the first few milliseconds to minutes after adding a test compound to a cell culture well, fluorescence and Förster resonance energy transfer (FRET) sensors pick up immediate receptor signalling. When a signalling peptide touches a cell surface receptor, engineered fluorescent proteins attached to the membrane shift a few nanometres closer together. This tiny movement changes the colour ratio of emitted light instantly. Within five to fifteen minutes, published studies tracking intracellular calcium waves or cyclic AMP spikes record sharp peaks in light intensity. At this early stage, no physical tissue remodelling has happened yet; the optical readout simply proves that the initial biochemical message arrived at the target.
Between one and six hours, the spectral timeline moves toward metabolic and transcriptional shifts. Raman spectroscopy and infrared absorption monitors begin picking up changes in cellular vibrations as nucleic acids and new proteins assemble. In laboratory models studying cellular energy, shifts in autofluorescence ratios between oxidised flavins and reduced nicotinamide adenine dinucleotide become steady and measurable around the four-hour mark. These readings confirm that the mitochondria have adjusted their output in response to the initial signal.
Days and weeks later, the optical focus turns to slow, physical structural changes. If a preclinical assay is measuring collagen organisation or extracellular matrix recovery, second-harmonic generation microscopy and Fourier-transform infrared spectroscopy come into play. Over seven to twenty-one days, newly laid collagen fibres align into dense bundles that scatter and double the frequency of incoming laser light. Early millisecond flashes tell researchers a pathway switched on, whereas multi-week spectral scans prove that the surrounding matrix actually rebuilt its physical architecture.
Common Spectroscopic Techniques for Evaluating Biomolecules in Laboratory Environments
| Spectroscopic Method | Wavelength Region | Primary Structural Target | Key Laboratory Observation |
|---|---|---|---|
| Ultraviolet-Visible (UV-Vis) Spectroscopy | 190 to 800 nanometres | Peptide bonds and aromatic rings (tryptophan, tyrosine) | Quantifies sample concentration and detects light scattering from large aggregates |
| Circular Dichroism (CD) | 180 to 260 nanometres (Far-UV) | Asymmetric carbon centres in the peptide backbone | Characterises secondary folding structures such as alpha-helices and beta-sheets |
| Fourier-Transform Infrared (FTIR) Spectroscopy | 2500 to 25000 nanometres | Amide I and Amide II vibrational modes | Analyses hydrogen bonding networks and identifies misfolded protein clusters |
| Fluorescence Spectroscopy | 280 to 350 nanometres (Excitation/Emission) | Intrinsic fluorophores and solvatochromic dyes | Monitors tertiary structural unfolding and local polarity changes in solution |
| Raman Spectroscopy | Monochromatic laser scatter (typically 532 to 785 nanometres) | Disulphide bridges and side-chain vibrations | Provides non-destructive structural fingerprints without interference from aqueous buffers |
Pairing Chromophores and Peptides for Clearer Optical Readouts
Pairing complementary molecules in a single optical assay requires careful planning so their light signatures do not clash. When researchers combine multiple peptides or fluorescent tags in the same well, evaluating spectral physics in laboratory environments helps separate how each compound behaves on its own versus how they act together.
A classic example involves pairing copper-binding sequences like GHK-Cu with mitochondrial research peptides such as SS-31 or structural fragments like BPC-157 in in-vitro fibroblast cultures. Because the copper ion in GHK-Cu gives the complex a distinct absorption band in the visible spectrum around six hundred nanometres, spectrophotometers can track its exact concentration independently of non-metallic peptides that only absorb deep in the ultraviolet range. This clean spectral separation allows investigators to run dual-compound protocols without one molecule masking the optical readout of the other.
In fluorescence-based synergy studies, scientists pair red-emitting and green-emitting reporters to watch two cellular pathways at once. For instance, one pathway linked to antioxidant recovery might be tagged with a green fluorophore excited at four hundred and eighty-eight nanometres, while a complementary pathway tied to extracellular matrix elasticity is tagged with a far-red dye excited at six hundred and forty nanometres. When two complementary peptides are introduced at a fixed protocol ratio, the spectrometer reads both colour channels simultaneously. If both channels brighten faster together than they do in separate control wells, the optical data confirms a cooperative response.
Furthermore, Förster resonance energy transfer relies entirely on pairing two compatible light-reactive groups. If a donor probe on one peptide transfers energy directly to an acceptor probe on a partner molecule without releasing a photon, it proves the two compounds are sitting less than ten nanometres apart. Choosing combinations with well-spaced absorption peaks prevents spectral bleed-through and keeps multi-peptide laboratory models crisp and readable.

Figure: Evaluating Spectral Physics in Laboratory Environments
Why Optical Clarity Demands 99%+ Purity and Cold Storage
Light-based instruments are unforgiving when a sample contains leftover manufacturing by-products. Evaluating spectral physics in laboratory environments only produces clean, trustworthy spectra when the starting material meets strict analytical benchmarks, beginning with a minimum of ninety-nine per cent purity verified by High-Performance Liquid Chromatography (HPLC).
During solid-phase synthesis, truncated amino acid chains and loose protecting groups can linger in the crude powder. Even a two or three per cent impurity level creates serious ghost peaks on an ultraviolet-visible spectrophotometer. Because incomplete peptide fragments contain the exact same amide bonds and aromatic rings as the target sequence, they absorb light at the exact same wavelengths. A researcher measuring the concentration of a low-grade vial by light absorption at two hundred and eighty nanometres will get an artificially high reading, throwing off the entire protocol ratio before the experiment even starts.
Trifluoroacetic acid (TFA) salts represent another major optical headache. TFA is routinely used to cleave peptides from synthesis resins, and if it is not swapped out for a cleaner counter-ion like acetate, it leaves a massive absorption spike in the far-ultraviolet region around two hundred and fifteen nanometres. That spike completely drowns out the peptide bond signal during circular dichroism scans, making it impossible to see whether the molecule is folded into an active helix or sitting as a tangled, inactive coil. Removing residual TFA ensures the optical window stays crystal clear.
Once a high-purity lyophilised powder is mixed with a bacteriostatic reconstitution solution, temperature control protects its optical behaviour. Storing vials between two and eight degrees Celsius in a dedicated laboratory fridge slows down thermal motion that causes chains to clump together. When peptides aggregate into microscopic clumps, they scatter incoming light beams in all directions—a phenomenon called Rayleigh scattering—which ruins absorbance baselines and clouds fluorescence readouts.
Frequently Asked Questions
Why are researchers evaluating spectral physics in laboratory environments?
Researchers are evaluating spectral physics in laboratory environments to observe how specific light wavelengths interact with cellular structures during tissue remodelling. Published studies show that measuring light absorption helps scientists characterise energy transfer in preclinical models. This provides clear data on how light signalling supports basic biological recovery processes.
What is a typical study timeline when observing spectral physics in the lab?
A typical laboratory study timeline spans from two to eight weeks of regular observation. During this period, scientists expose cellular samples or preclinical models to a measured level of light energy. They then analyse the gradual stages of cellular repair and energy signalling at fixed weekly intervals.
Can spectral wavelengths be combined or stacked in laboratory models?
Yes, researchers frequently combine multiple light wavelengths, such as red and near-infrared bands, within the same laboratory protocol. Published studies indicate that stacking different spectral bands allows scientists to observe overlapping signalling pathways at once. This dual approach helps teams analyse how various tissue depths respond to combined energy.
How do laboratories maintain calibration purity and cold storage for optical sensors?
Laboratories maintain spectral purity by using calibrated filters and storing sensitive biological assays or optical reagents in a fridge at four degrees Celsius. If photoreactive compounds require preparation, technicians use a sterile bacteriostatic reconstitution solution. Strict temperature control prevents degradation and ensures accurate, repeatable measurements across every experiment.
Bibliography
- Greenfield NJ. Using circular dichroism spectra to estimate protein secondary structure. Nature Protocols. 2006;1(6):2876-2890. View published research
- Barth A. Infrared spectroscopy of proteins. Biochimica et Biophysica Acta (BBA) - Bioenergetics. 2007;1767(9):1073-1101. View published research
- Rygula A, Majzner K, Marzec KM, Kaczor A, Pilarczyk M, Baranska M. Raman spectroscopy of proteins: a review. Journal of Raman Spectroscopy. 2013;44(8):1061-1076. View published research
- Anthis NJ, Clore GM. Sequence-specific determination of protein and peptide concentrations by absorbance at 205 nm. Protein Science. 2013;22(6):851-858. View published research
- Royer CA. Probing protein folding and conformational transitions with fluorescence. Chemical Reviews. 2006;106(5):1769-1784. View published research
See our UK peptide research guides & COA briefings first in Google Search.
Add Amino Peptides UK as a Preferred Source on Google⚠️ Research Use Only Disclaimer: All peptides and compounds are sold strictly for in-vitro laboratory research purposes only. Not intended for human or veterinary use, not a dietary supplement, and not approved to diagnose, treat, cure, or prevent any disease or condition. For use by qualified researchers in suitably equipped laboratory environments only. Amino Peptides Ltd operates in full compliance with UK MHRA regulations and applicable EU research chemical guidelines.